Is This Bounce Sustainable for Growth Stocks?
US500
-0.17%
Add to/Remove from Watchlist
Add to Watchlist
Add Position
Position added successfully to:
Please name your holdings portfolio
Type:
BUY
SELL
Date:
Amount:
Price
Point Value:
Leverage:
1:1
1:10
1:25
1:50
1:100
1:200
1:400
1:500
1:1000
Commission:
Create New Watchlist
Create
Create a new holdings portfolio
Add
Create
+ Add another position
Close
US2000
-1.82%
Add to/Remove from Watchlist
Add to Watchlist
Add Position
Position added successfully to:
Please name your holdings portfolio
Type:
BUY
SELL
Date:
Amount:
Price
Point Value:
Leverage:
1:1
1:10
1:25
1:50
1:100
1:200
1:400
1:500
1:1000
Commission:
Create New Watchlist
Create
Create a new holdings portfolio
Add
Create
+ Add another position
Close
IWO
-1.66%
Add to/Remove from Watchlist
Add to Watchlist
Add Position
Position added successfully to:
Please name your holdings portfolio
Type:
BUY
SELL
Date:
Amount:
Price
Point Value:
Leverage:
1:1
1:10
1:25
1:50
1:100
1:200
1:400
1:500
1:1000
Commission:
Create New Watchlist
Create
Create a new holdings portfolio
Add
Create
+ Add another position
Close
IXIC
+0.14%
Add to/Remove from Watchlist
Add to Watchlist
Add Position
Position added successfully to:
Please name your holdings portfolio
Type:
BUY
SELL
Date:
Amount:
Price
Point Value:
Leverage:
1:1
1:10
1:25
1:50
1:100
1:200
1:400
1:500
1:1000
Commission:
Create New Watchlist
Create
Create a new holdings portfolio
Add
Create
+ Add another position
Close
After the NASDAQ Composite has sold off 8.8% since July 19th, we’ve witnessed a marked bounce over the last 10 sessions of 7%.
However, as much as volume has been above-average and rising in the decline, volume has been muted and below-average in the bounce, signaling lack of demand. In fact, 8 out of the last 25 trading sessions have shown outright or masked selling:
 NASDAQ Composite: High-volume distribution and low-volume rally
The NASDAQ is the most relevant index to look at in this context, because its main constituents (the ‘MegaCap-8’) have been the main driver of the 2023 stock market rally.
The S&P 500, similarly biased to the mega-caps due to its extreme cap-weighting, shows a similar dynamic, though less pronounced because of its composition of various cyclical stocks (financials, resource, etc): S&P500: High-volume distribution and low-volume rally
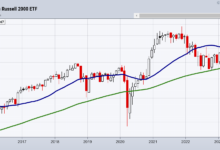
If we widen out our prism and look at the mid- and small-cap space, specifically the growth stock space (to which all the MegaCap-8, a.k.a. The Magnificent 7 stocks belong), we see the same over and over, as for example shown by the iShares Russell 2000 Growth ETF (NYSE:IWO):
 IWO: High-volume distribution and low-volume rally
In fact, this risk-on segment of the market has never confirmed the rally staged by the popular indices NASDAQ & S&P 500. It has not even successfully staged a reversal of its long-term downtrend starting end of 2021:
 IWO: A upside trend reversal of the mid- and small-cap growth space has been rejected
Looking at stocks making new price Highs (thereby a proxy for buying demand), we see that the NHNL gauge (measuring issues at new Highs – issues at new Lows) implies that “growth” issues from the NASDAQ exchange never really ignited in the whole rally of 2023 (in fact there is a bearish divergence between the February and August peaks), while the more Cyclicals-dominated NYSE issues have been dominating.
Given that NASDAQ-type stocks had been leading this rally, this is concerning as it reinforces the very thin breadth of this rally.
The current bounce shows a similar, though much more degraded dynamic:
 New High – New Low gauge: Growth issues once again lag
In summary:
- It appears the current bounce is largely driven by lackluster dip-buying and not committed accumulation by institutional money
- There is continued risk-off sentiment observable in the leading parts of the market
- A general lack of liquid stocks with strong fundamentals entering price exploration into new High price ground is another red flag
Based on these indications, we might see a continued bounce, but odds for a risk-on growth-driven rally are low.


