Nasdaq, S&P 500 Eye 200 MA Support; Russell 2000 to Bottom First: What’s Next?
US500
+0.42%
Add to/Remove from Watchlist
Add to Watchlist
Add Position
Position added successfully to:
Please name your holdings portfolio
Type:
BUY
SELL
Date:
Amount:
Price
Point Value:
Leverage:
1:1
1:10
1:25
1:50
1:100
1:200
1:400
1:500
1:1000
Commission:
Create New Watchlist
Create
Create a new holdings portfolio
Add
Create
+ Add another position
Close
US2000
-0.32%
Add to/Remove from Watchlist
Add to Watchlist
Add Position
Position added successfully to:
Please name your holdings portfolio
Type:
BUY
SELL
Date:
Amount:
Price
Point Value:
Leverage:
1:1
1:10
1:25
1:50
1:100
1:200
1:400
1:500
1:1000
Commission:
Create New Watchlist
Create
Create a new holdings portfolio
Add
Create
+ Add another position
Close
IWM
-0.34%
Add to/Remove from Watchlist
Add to Watchlist
Add Position
Position added successfully to:
Please name your holdings portfolio
Type:
BUY
SELL
Date:
Amount:
Price
Point Value:
Leverage:
1:1
1:10
1:25
1:50
1:100
1:200
1:400
1:500
1:1000
Commission:
Create New Watchlist
Create
Create a new holdings portfolio
Add
Create
+ Add another position
Close
IXIC
+1.24%
Add to/Remove from Watchlist
Add to Watchlist
Add Position
Position added successfully to:
Please name your holdings portfolio
Type:
BUY
SELL
Date:
Amount:
Price
Point Value:
Leverage:
1:1
1:10
1:25
1:50
1:100
1:200
1:400
1:500
1:1000
Commission:
Create New Watchlist
Create
Create a new holdings portfolio
Add
Create
+ Add another position
Close
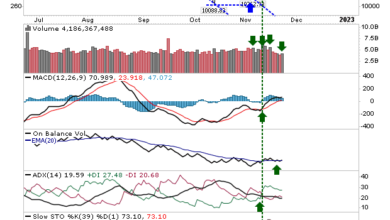
What was relatively orderly selling from the July peak has now seen an acceleration in the selling over the last two days. The volume hasn’t been extensive, but it’s hard for buyers to gain confidence when it is one step forward and two (or three) steps back.
The Nasdaq has the most room to fall. While buyers can step in at any time (creating a support level), historically, it’s looking like a test of 12,250 is the next point of contact for bulls.
 COMPQ Daily Chart
The Russell 2000 has now lost mid-line stochastic support leaving it vulnerable to additional losses, at least until intermediate stochastics are oversold. I would be looking at $180 (IWM) for support, although the 200-day MA will be a stop along the way.
The relative performance of the index to the S&P 500 is scrappy and lacking direction, but it’s likely to be the index to find a bottom first.
 IWM Daily Chart
The S&P 500 was the index that had the cleanest buying opportunity, but this didn’t last long. The test of support didn’t evolve as one, with no attempt at a bounce. As with the Nasdaq, it’s a long way down to 200-day MA support. The volume ranked as distribution, but the selling has been relatively tame.
 SPX Daily Chart
Going forward, it’s time to let the decline play out to its fullest. Look to breadth metrics like the Nasdaq percentage of stocks above the 50-day and 200-day MA when they reach an oversold condition as a cue to become a buyer.