Treasury Bonds Poised for a Big Move
TLT
+0.03%
Add to/Remove from Watchlist
Add to Watchlist
Add Position
Position added successfully to:
Please name your holdings portfolio
Type:
BUY
SELL
Date:
Amount:
Price
Point Value:
Leverage:
1:1
1:10
1:25
1:50
1:100
1:200
1:400
1:500
1:1000
Commission:
Create New Watchlist
Create
Create a new holdings portfolio
Add
Create
+ Add another position
Close
TNX
-0.44%
Add to/Remove from Watchlist
Add to Watchlist
Add Position
Position added successfully to:
Please name your holdings portfolio
Type:
BUY
SELL
Date:
Amount:
Price
Point Value:
Leverage:
1:1
1:10
1:25
1:50
1:100
1:200
1:400
1:500
1:1000
Commission:
Create New Watchlist
Create
Create a new holdings portfolio
Add
Create
+ Add another position
Close
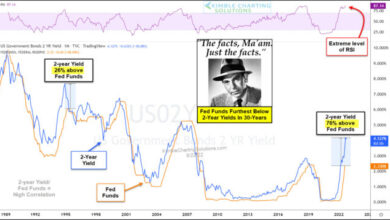
As the Federal Reserve continues to fight inflation by raising interest rates, the market is growing uncertain about future rate hikes.
Today, we share a chart comparing the 10 Year Treasury Yield versus the popular iShares 20+ Year Treasury Bond ETF (NASDAQ:TLT).
 10-Year Yield Daily Chart
As you can see, both yields and bond prices have formed narrowing patterns… and both of these patterns are nearing completion.
If bond yields (blue) break down and bond prices (orange) breakout higher, we could see some mean reversion leading to lower interest rates. But if the patterns break the other way, it may mean higher interest rates.
Either way, something is about to happen. Follow the breakouts or breakdowns.